Learn Technical Analysis
With Lots Of Real Chart Examples
- Learn a wide range of Technical Analysis tools and techniques from basic price action and chart patterns, to Fibonacci tools and technical indicators, and much more.
- All explained with real chart examples from the stock market, cryptocurrency charts, forex charts, and commodity futures charts.
- Information is generally applicable no matter the specific chart, market, and/or time frame/range/period since example cover a wide range conditions in terms of charts, the types of markets they are from.
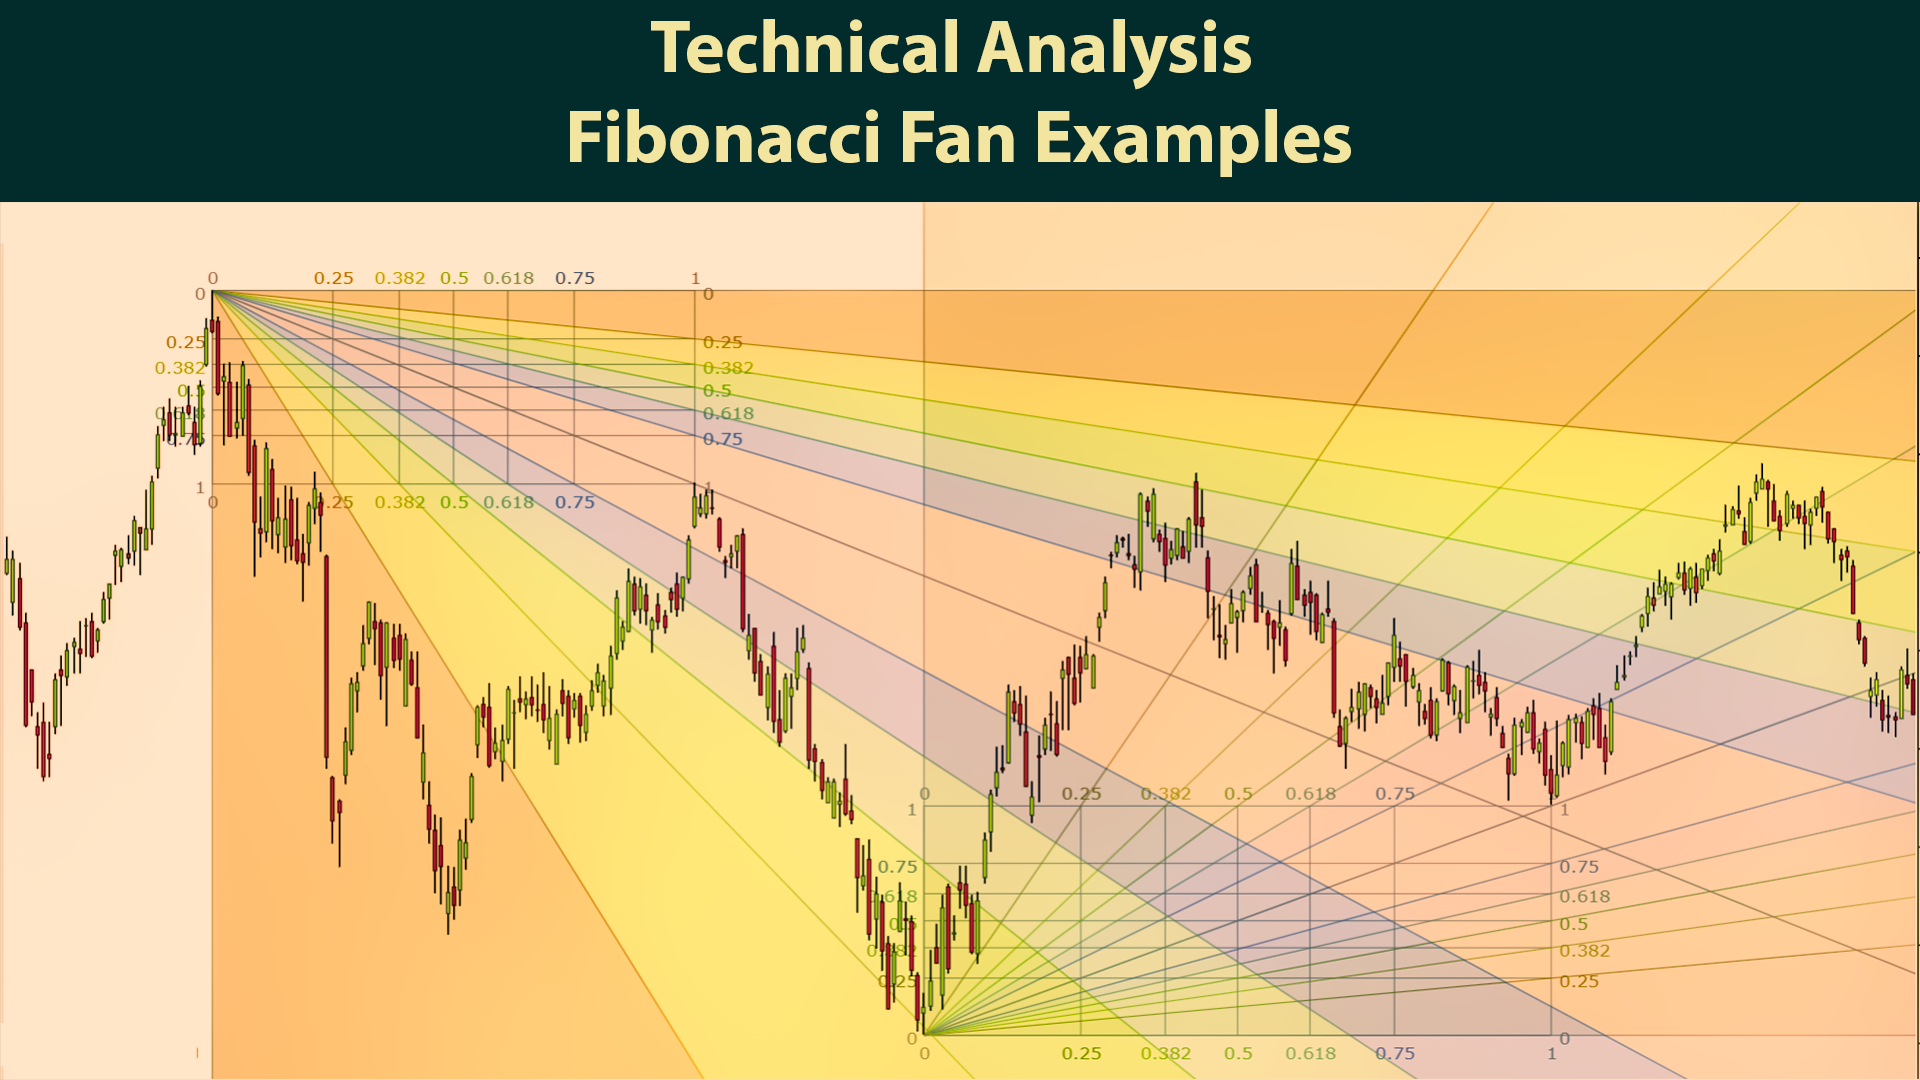
Fibonacci Strategies For Stock Charts Explained With Real Chart Examples
Ascencore • November 17, 2023
Watch The Full Series On Fibonacci Strategies For Stock Chart Technical Analysis
This is a series explaining how to use Fibonacci Strategies To Analyze Stock Charts.
Understand every Fibonacci analysis tool through real chart examples.
Learn how to apply Fibonacci Strategies that combine; Retracements, Extensions, Projections, Time Zones, Trend Based Time Zones, Speed Resistance Fans, Speed Resistance Arcs, Circles, Spirals, Channels, Wedges, along with other tools, indicators, and methods to analyze charts. See the pros and cons of these strategy combinations and which conditions are preferred and unsuitable for their use.

This is a series explaining how to use Keltner Channels.
Understand what the Keltner Channels is through real chart examples.
Learn how to apply Keltner Channels to analyze charts and see the pros and cons of this indicator and which conditions are preferred and unsuitable for its use.
Enhance candlestick charting analysis skills through the use of detailed cases studies.
Improve your ability to understand general price action in various market contexts.
Experience dozens of scenarios from the stock market that include ETF, index, & individual stock charts to fully comprehend market movements before, during, and after they development.
This is a series explaining how to do candlestick charting analysis with examples from markets around the world and from different time ranges.
Thus information from this series can generally be applicable to some degree for whichever charts you choose to analyze with candlestick patterns.

This is a series explaining how to use Fibonacci Strategies To Analyze Cryptocurrency Charts.
Understand every Fibonacci analysis tool with real chart examples.
Learn how to apply Fibonacci Strategies that combine; Retracements, Extensions, Projections, Time Zones, Trend Based Time Zones, Speed Resistance Fans, Speed Resistance Arcs, Circles, Spirals, Channels, Wedges, along with other tools, indicators, and methods to analyze Cryptocurrency charts. See the pros and cons of these strategy combinations and which conditions are preferred and unsuitable for their use.

This is a series explaining how to use the Fibonacci Wedge.
Understand what the Fibonacci Wedge is through real chart examples.
Learn how to apply the Fibonacci Wedge to analyze charts and see the pros and cons of this tool and which conditions are preferred and unsuitable for its use.
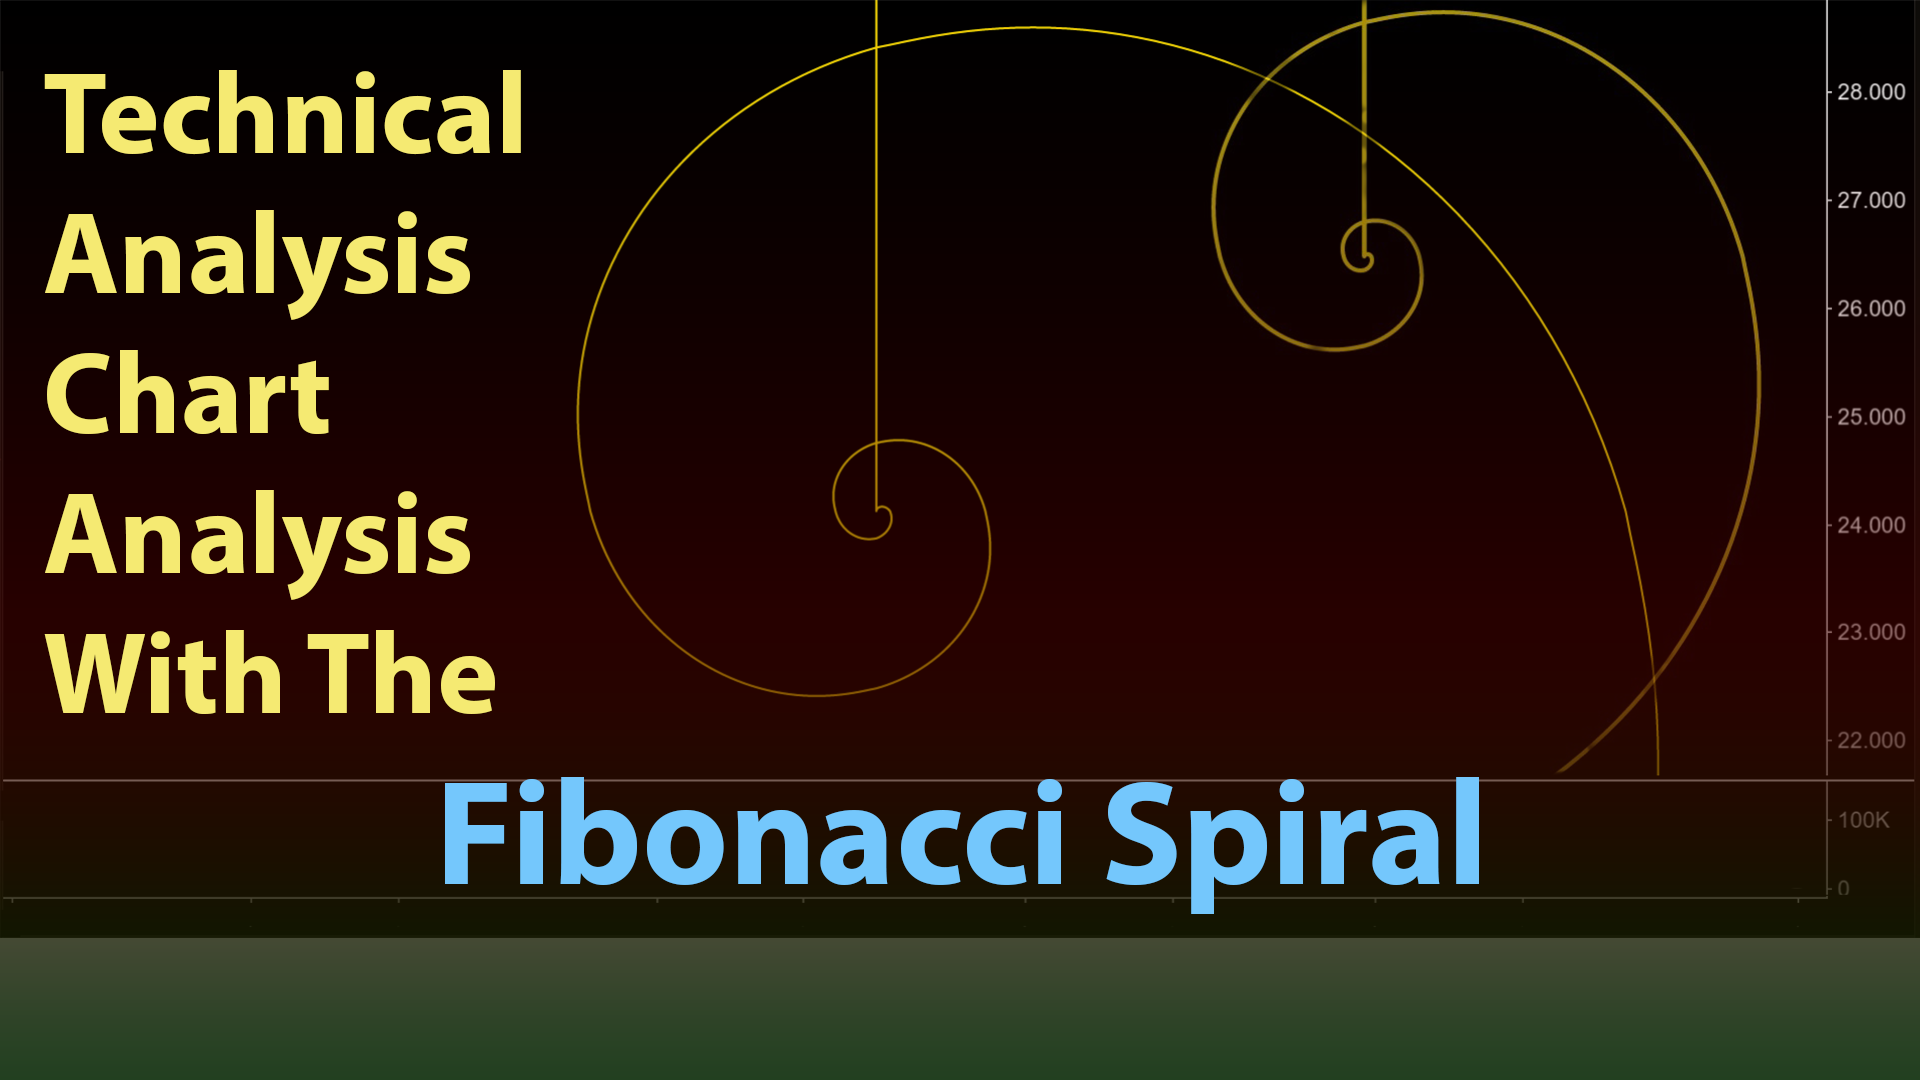
Through the use of lots of examples on real charts you will learn the many ways Fibonacci Spirals can be applied.
See stock, currency, and commodity futures chart examples.
This is a series explaining, examining, and exploring Fibonacci Speed Resistance Fans.
There will be explanations of Fibonacci Speed Resistance Fan tool, discussions of its uses, common advantageous uses, & limitations.
Then there will be lots of case studies showing Fibonacci Speed Resistance Fans applied in various settings.
All this is done with real chart examples with clear concise details displayed.
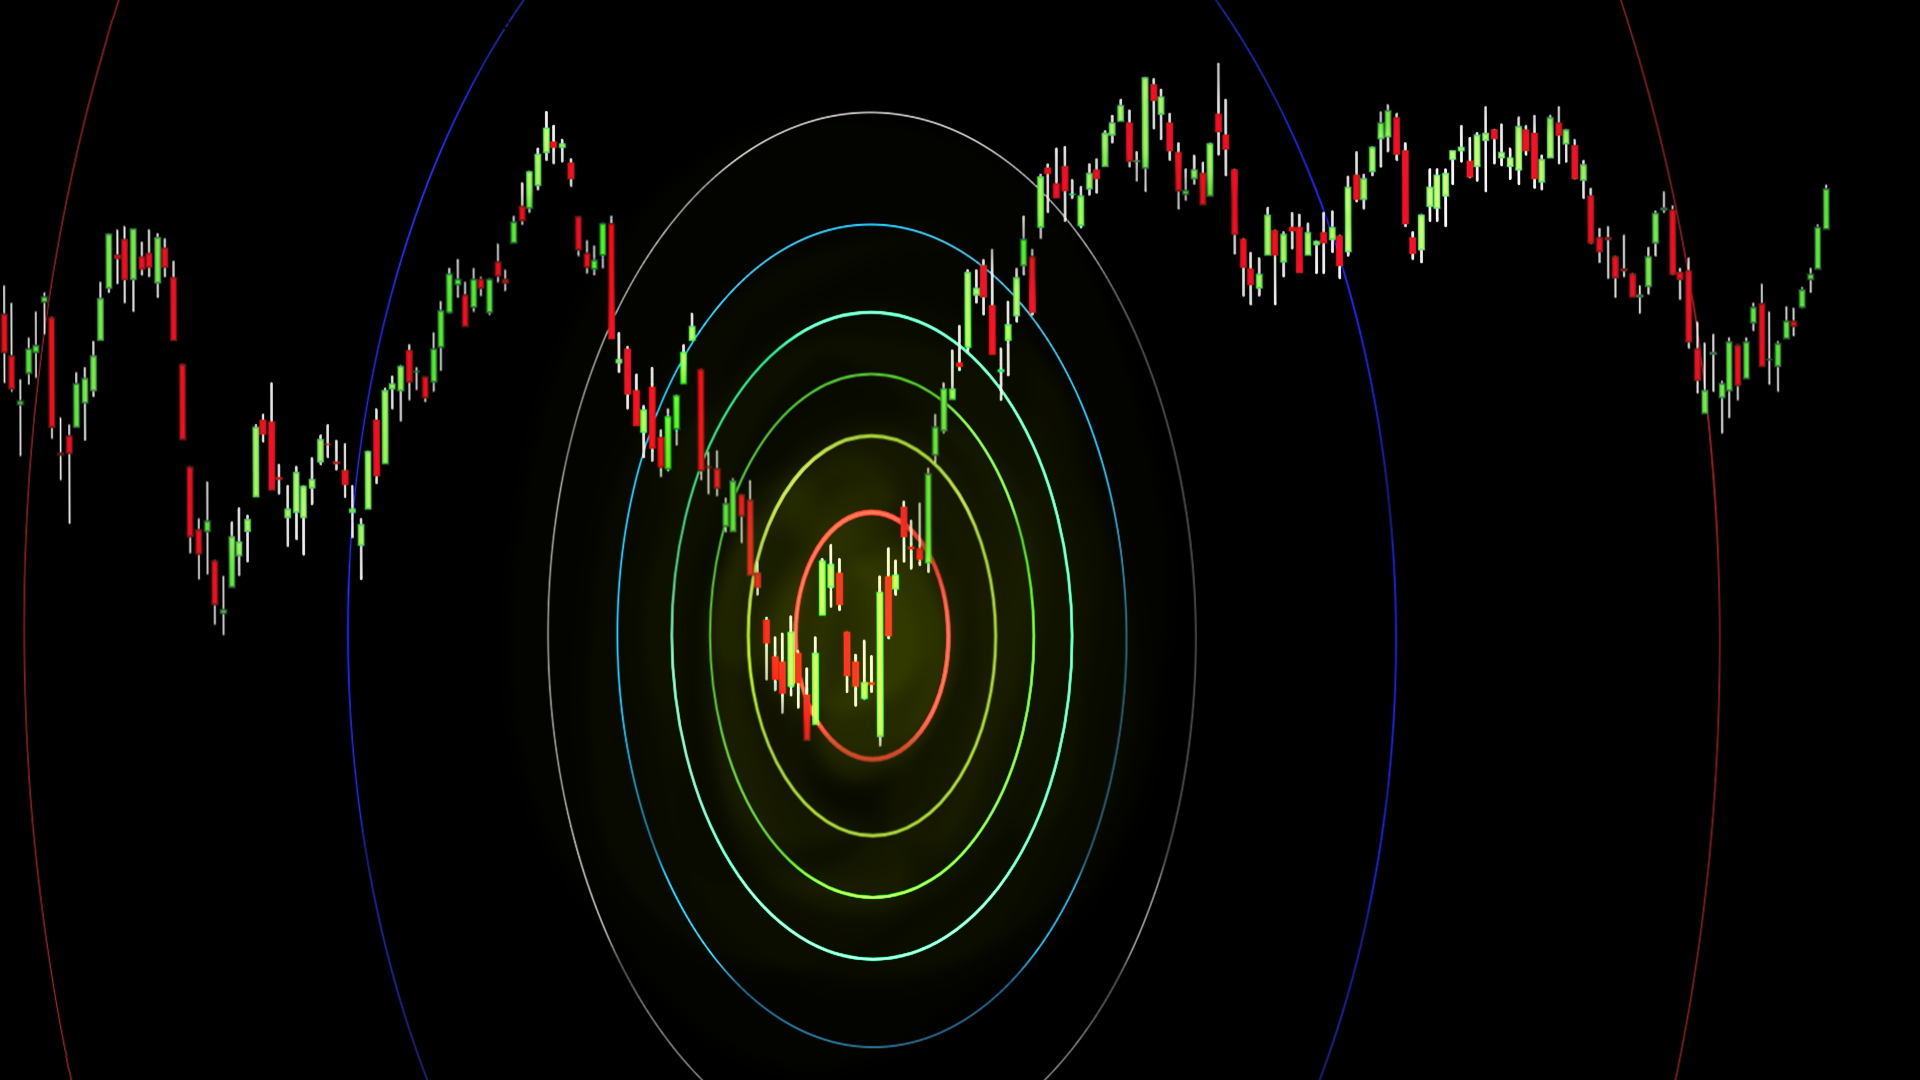
This is a series explaining, examining, and exploring Fibonacci Circles.
There will be explanations of Fibonacci Circles, discussions of its uses, common advantageous uses, & limitations.
Then there will be lots of case studies showing Fibonacci Circles applied in various settings.
All this is done with real chart examples with clear concise details displayed.
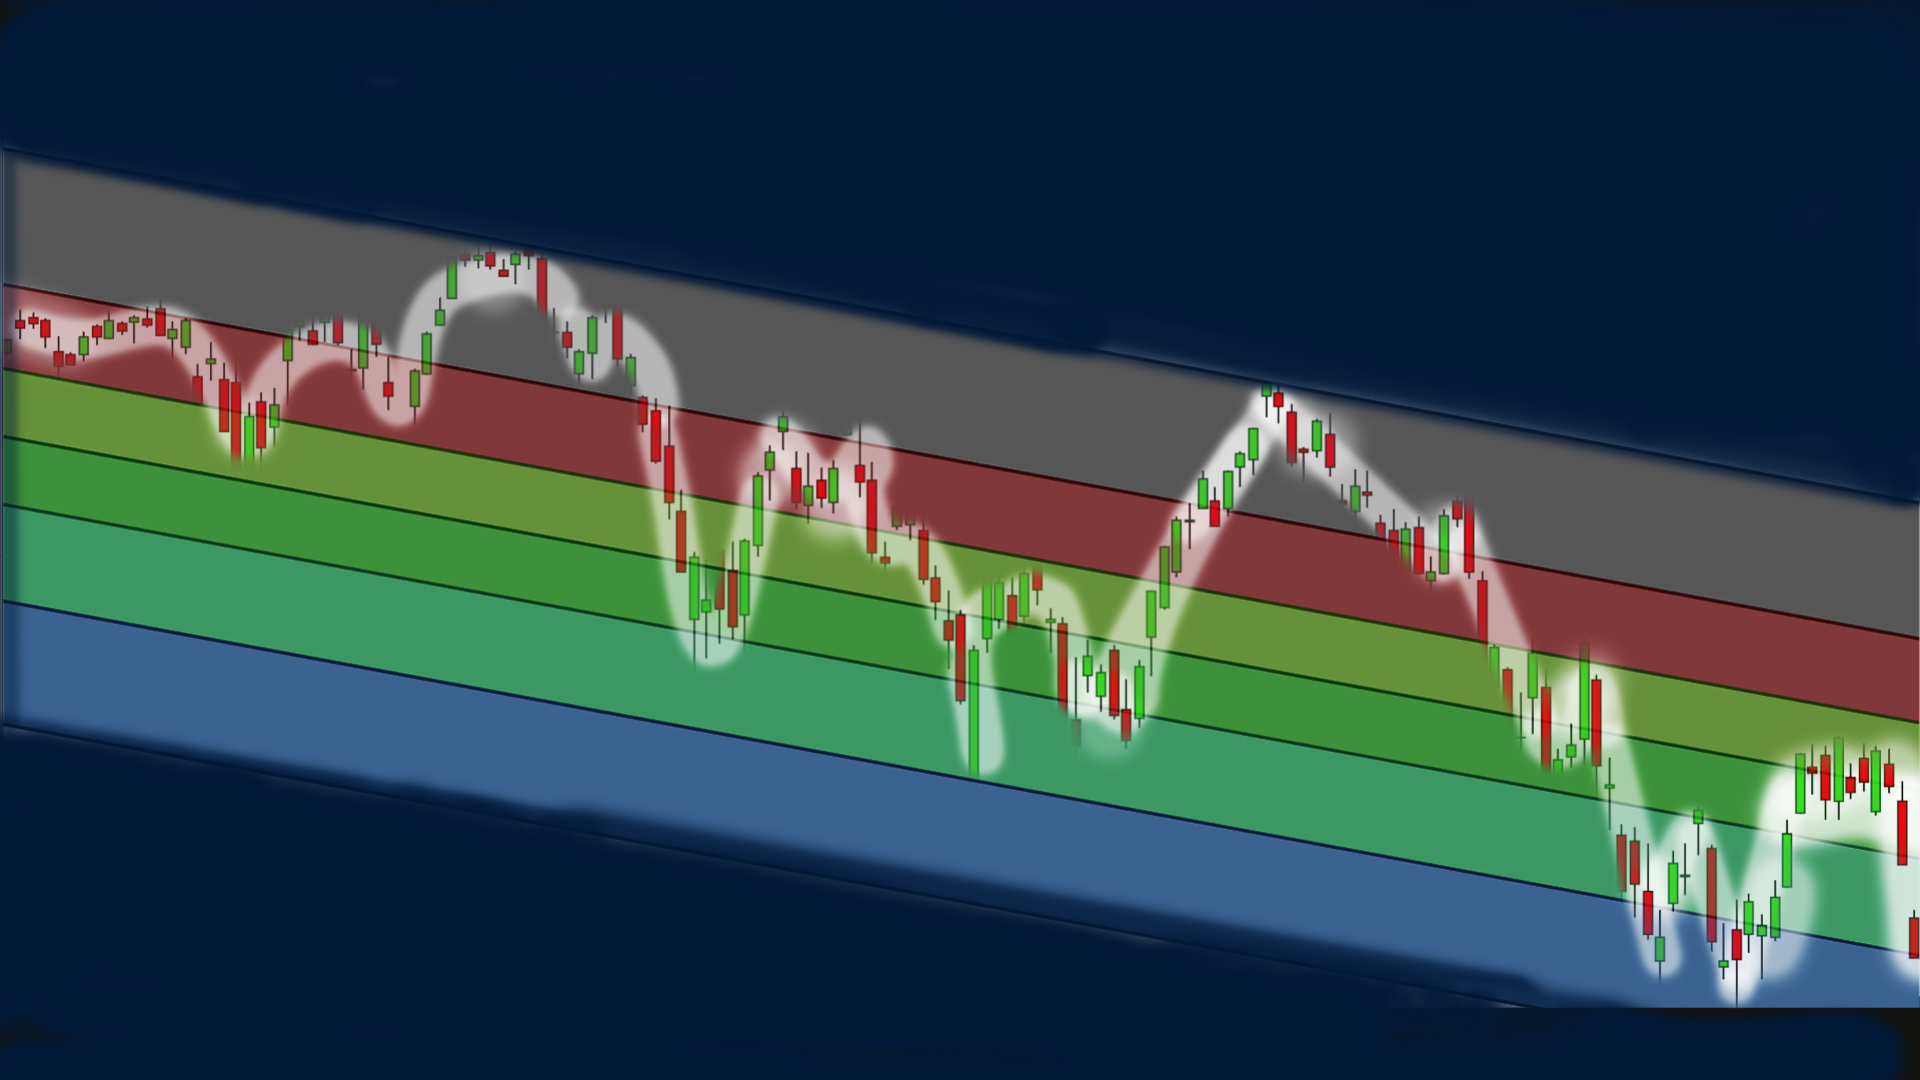
This is a series explaining, examining, and exploring the Fibonacci Channel tool.
There will be explanations of the Fibonacci Channel, discussions of its uses, common advantageous uses, & limitations.
Then there will be lots of case studies showing Fibonacci Channels applied in various settings.
All this is done with real chart examples with clear concise details displayed.

This is a series explaining Fibonacci Speed Resistance Arcs.
There will be explanations of Fibonacci Speed Resistance Arcs, discussions of its uses, common advantageous uses, & limitations.
Then there will be lots of case studies showing Fibonacci Speed Resistance Arcs applied in various settings.
All this is done with real chart examples with clear concise details displayed.
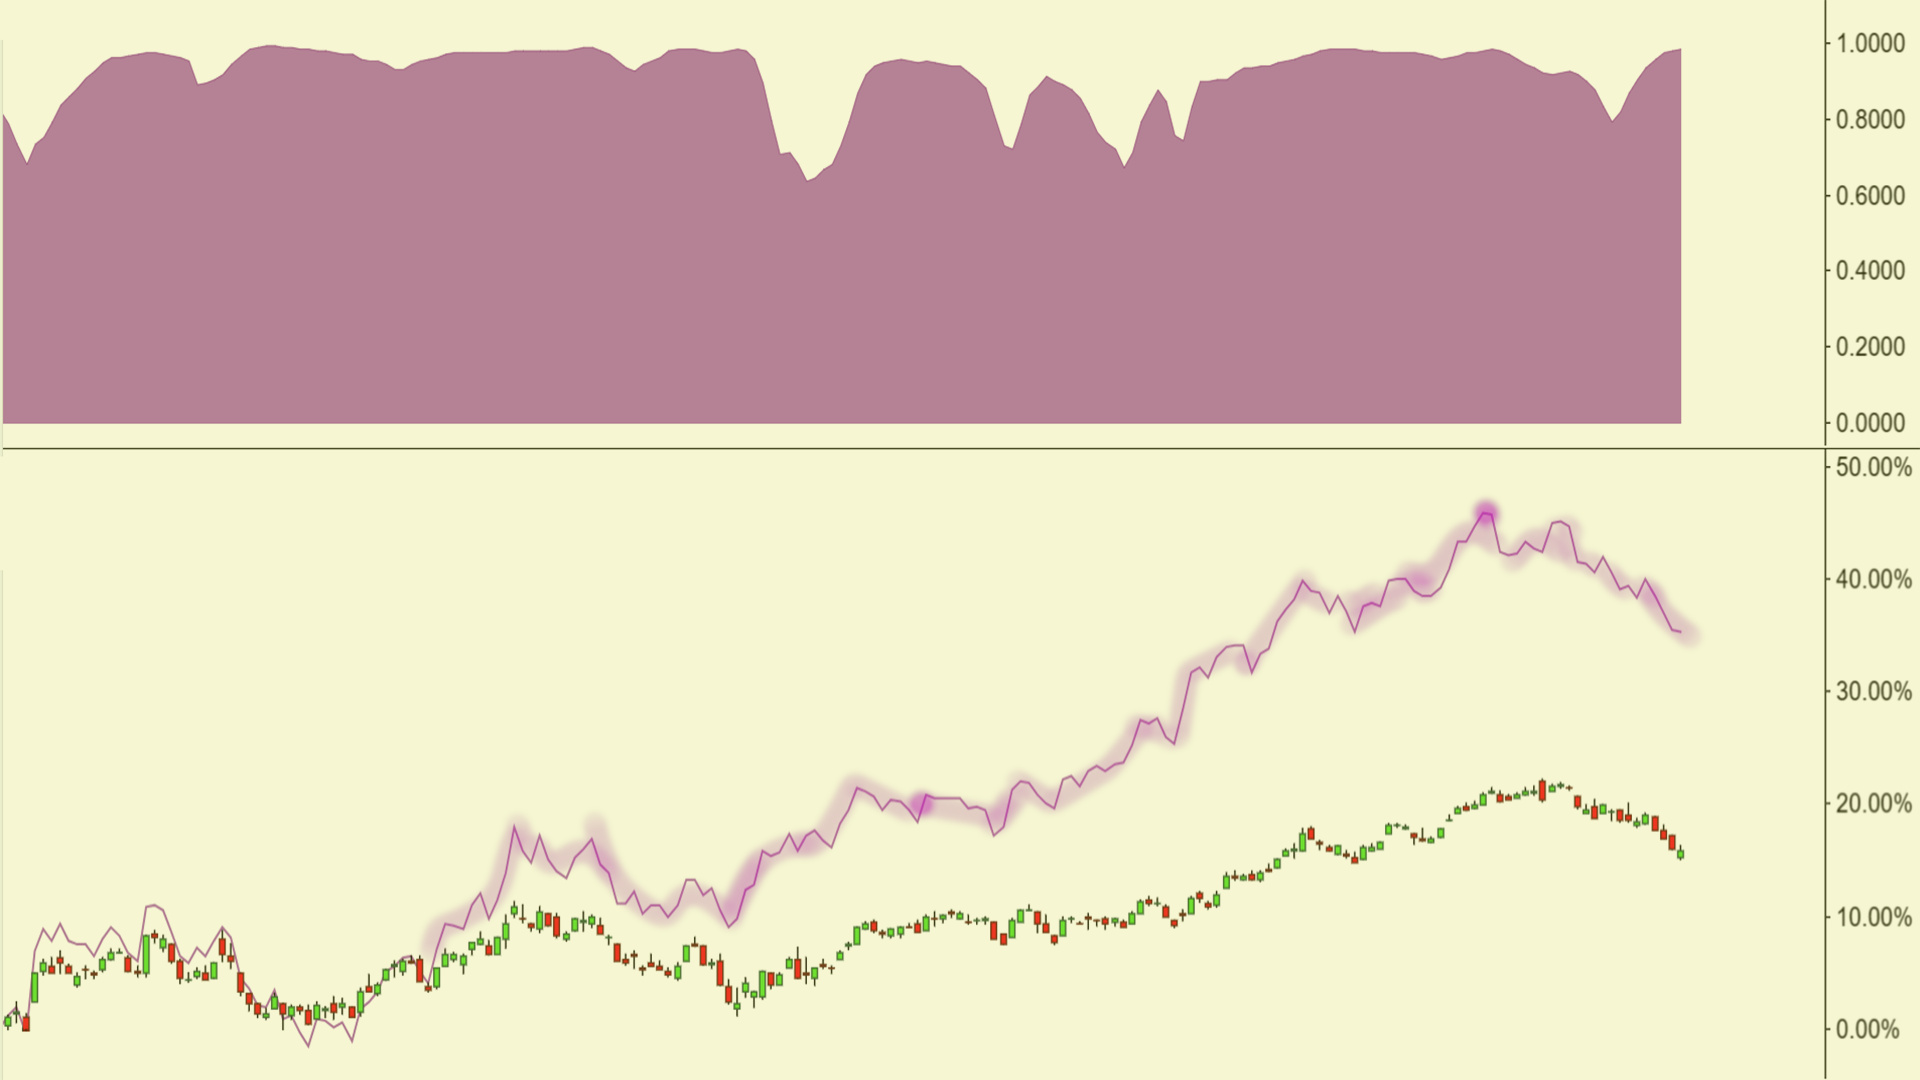
This is a series explaining how to use the Correlation Coefficient Indicator .
Understand what the Correlation Coefficient Indicator is through real chart examples.
Learn how to apply the Correlation Coefficient Indicator to analyze charts and see the pros and cons of this the Correlation Coefficient Indicator and which conditions are preferred and unsuitable for its use.
This is a series explaining how to use Keltner Channels.
Understand what the Keltner Channels is through real chart examples.
Learn how to apply Keltner Channels to analyze charts and see the pros and cons of this indicator and which conditions are preferred and unsuitable for its use.
Enhance candlestick charting analysis skills through the use of detailed cases studies.
Improve your ability to understand general price action in various market contexts.
Experience dozens of scenarios from the stock market that include ETF, index, & individual stock charts to fully comprehend market movements before, during, and after they development.
This is a series explaining how to do candlestick charting analysis with examples from markets around the world and from different time ranges.
Thus information from this series can generally be applicable to some degree for whichever charts you choose to analyze with candlestick patterns.
This is a series explaining how to use Fibonacci Strategies To Analyze Cryptocurrency Charts.
Understand every Fibonacci analysis tool with real chart examples.
Learn how to apply Fibonacci Strategies that combine; Retracements, Extensions, Projections, Time Zones, Trend Based Time Zones, Speed Resistance Fans, Speed Resistance Arcs, Circles, Spirals, Channels, Wedges, along with other tools, indicators, and methods to analyze Cryptocurrency charts. See the pros and cons of these strategy combinations and which conditions are preferred and unsuitable for their use.
This is a series explaining how to use the Fibonacci Wedge.
Understand what the Fibonacci Wedge is through real chart examples.
Learn how to apply the Fibonacci Wedge to analyze charts and see the pros and cons of this tool and which conditions are preferred and unsuitable for its use.
Through the use of lots of examples on real charts you will learn the many ways Fibonacci Spirals can be applied.
See stock, currency, and commodity futures chart examples.
This is a series explaining, examining, and exploring Fibonacci Speed Resistance Fans.
There will be explanations of Fibonacci Speed Resistance Fan tool, discussions of its uses, common advantageous uses, & limitations.
Then there will be lots of case studies showing Fibonacci Speed Resistance Fans applied in various settings.
All this is done with real chart examples with clear concise details displayed.
This is a series explaining, examining, and exploring Fibonacci Circles.
There will be explanations of Fibonacci Circles, discussions of its uses, common advantageous uses, & limitations.
Then there will be lots of case studies showing Fibonacci Circles applied in various settings.
All this is done with real chart examples with clear concise details displayed.
This is a series explaining, examining, and exploring the Fibonacci Channel tool.
There will be explanations of the Fibonacci Channel, discussions of its uses, common advantageous uses, & limitations.
Then there will be lots of case studies showing Fibonacci Channels applied in various settings.
All this is done with real chart examples with clear concise details displayed.
This is a series explaining Fibonacci Speed Resistance Arcs.
There will be explanations of Fibonacci Speed Resistance Arcs, discussions of its uses, common advantageous uses, & limitations.
Then there will be lots of case studies showing Fibonacci Speed Resistance Arcs applied in various settings.
All this is done with real chart examples with clear concise details displayed.
This is a series explaining how to use the Correlation Coefficient Indicator .
Understand what the Correlation Coefficient Indicator is through real chart examples.
Learn how to apply the Correlation Coefficient Indicator to analyze charts and see the pros and cons of this the Correlation Coefficient Indicator and which conditions are preferred and unsuitable for its use.